Q2 Traveler Insights Report: Enthusiasm for Travel Endures
[ad_1]
For more than a year we have been tracking and sharing indicators of how travelers are looking and booking trips again in quarterly reports based on insights from our Expedia Group first-party data and custom research, to inform our partners’ marketing strategies. In our Q1 2022 report, we highlighted how search windows were lengthening and opportunities for our partners to rebuild, and even to reimagine travel, to meet the growing demand for sustainable travel options.
Now looking at Q2 2022, while the travel industry faced additional challenges—including recession concerns and chaotic airports—travelers remain undeterred, and are even looking to venture farther afield. Along with sustainability, people want to see travel options that are inclusive and accessible, and real commitments to welcoming travelers of all types and supporting local cultures and communities. Read on for the key takeaways from our Q2 2022 Traveler Insights Report.
Travel searches hold steady
Traveler intent to get away remained strong as international travel restrictions continued to lift during the second quarter of the year.
Following a 25% quarter-over-quarter surge between Q4 last year and Q1 2022, travel search volumes globally held steady in Q2. At the regional level, we even saw double-digit growth between Q1 and Q2 – especially in APAC, which saw a 30% increase in the region.
After the announcement on June 10 that the U.S. was lifting its pre-departure testing requirement for international air travelers, international searches globally spiked 10% in the week of June 13, while searches from APAC and EMEA destinations increased by double digits. This is a strong signal that travel shoppers continue to feel enthusiastic about making plans.
Travel intent drives growth in 2–3-month search window
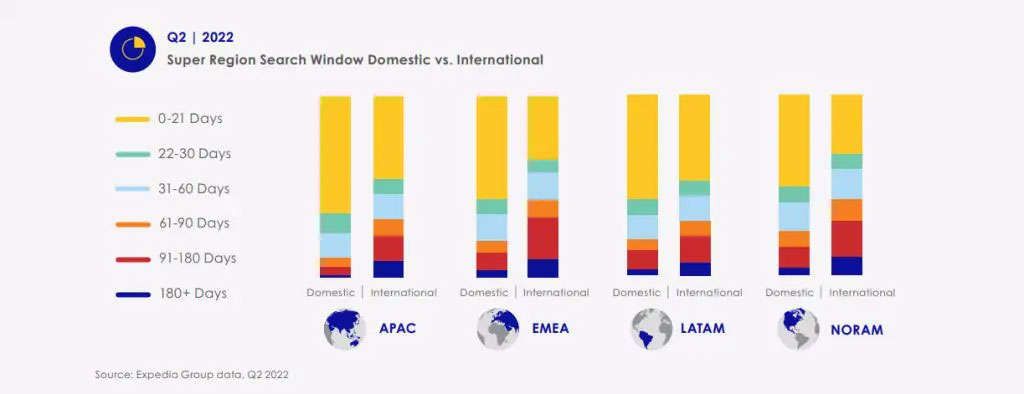
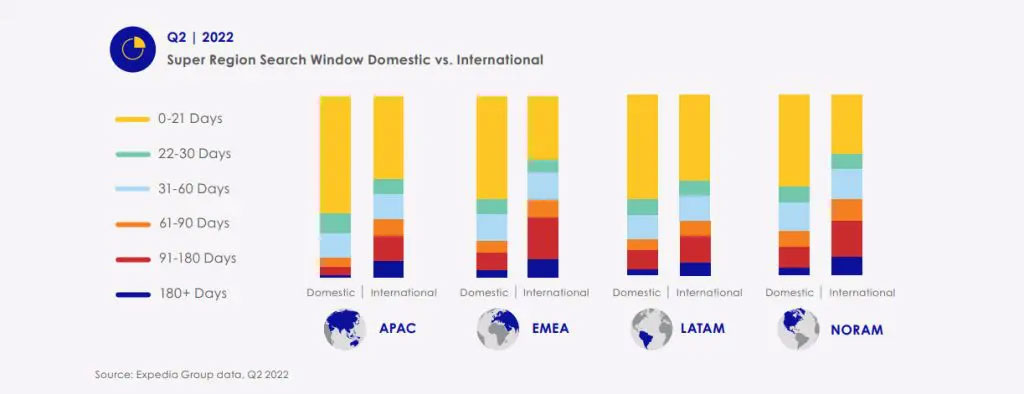
Compared to Q1, we did see search windows shorten in Q2 globally, with searches in the 91- to 180–day window decreasing more than 20% quarter-over-quarter. On the other hand, searches in the 0- to 90–day search window increased more than 5% quarter-over-quarter. The 61- to 90–day window had the largest growth at 15%.
This may be because Q1 was when most travel shoppers were planning their mid-year vacations, and the decline in share volume in Q2 was simply a stabilization. It may also be that travel shoppers are biding their time, hoping that fuel costs—and thus flight prices—will go down. Yet this is also aligned with the findings of an April 2022 Expedia Group survey in which most consumers planning to travel within 12 months feel comfortable booking actual travel within 3 months of their trip.
Long-haul destinations make a comeback
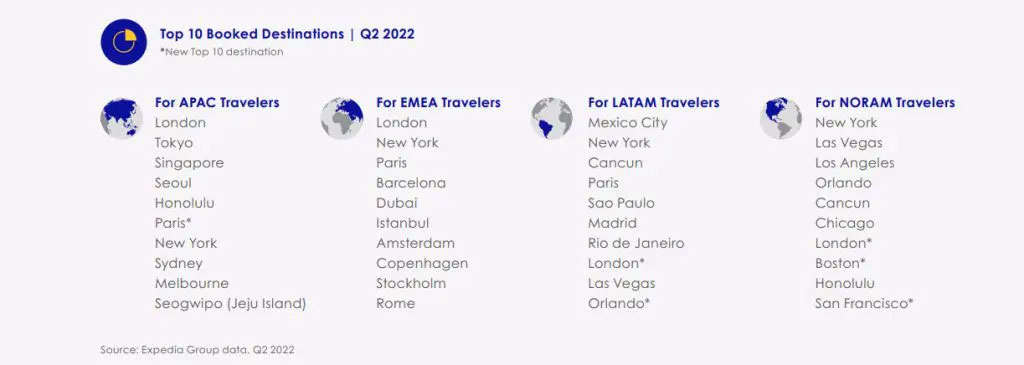
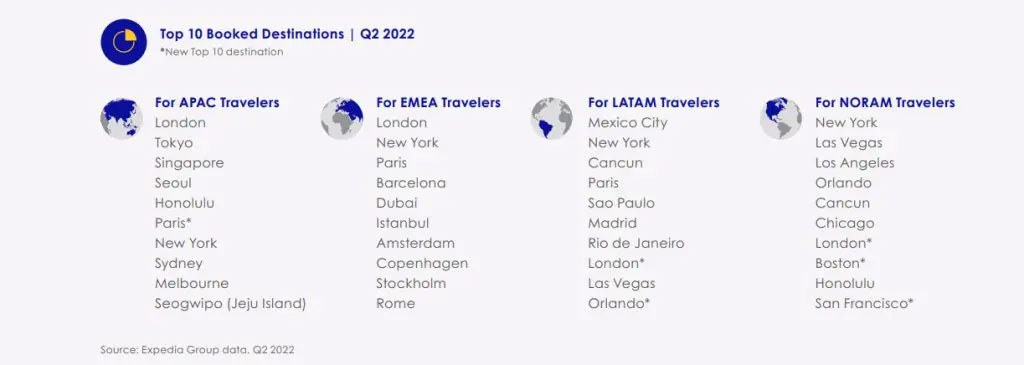
As we’ve seen in quarters past, big cities and beaches remained popular around the world, but London and Paris both proved especially popular with travelers across all regions. In fact, London was the top-booked city for travelers in APAC and EMEA and entered the top 10 for LATAM and NORAM. Paris, a trending city in our last quarterly report, entered the global top 10 at number 7, and was also in the top 10 regional lists for all but North America.
We see that far-off destinations are making a comeback in the demand for long-haul flights, too (flights 4+ hours or longer). In fact, we saw more than a 50% increase in global traveler demand for long-haul flights, and an even stronger showing for flights from the U.S. to Europe, which had more than 100% year-over-year growth.
Strong demand despite rising costs
In addition to demand for long-haul flights, we’ve seen sustained growth in the lodging sector, with demand for lodging holding strong. Following a strong Q1, during which lodging demand grew by double-digits quarter-over-quarter, we saw more moderate growth in Q2, with APAC seeing the strongest growth.
This strong demand for travel is despite rising costs. Compared to Q2 2019, the global average air ticket was up by double-digits, led by EMEA and APAC. This may be due to the demand itself, rising fuel costs, and an increase in longer-distance flights being booked.
Opportunities for inclusive travel
The enthusiasm for travel, even with rising costs and industry instability, means there’s an opportunity for travel marketers to inspire and engage. As shared in our Inclusive Travel Insights Report, travelers are willing to pay more if the travel options align with their values, particularly around inclusion and diversity.
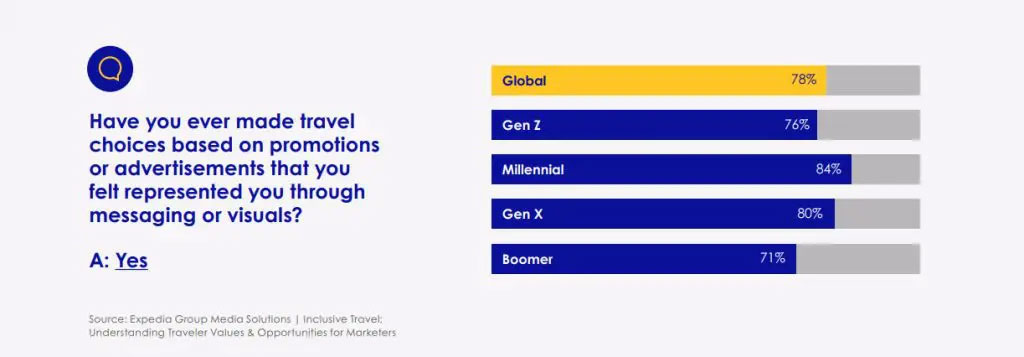
In a recent survey of 11,000 consumers in 11 countries, we learned that 7 in 10 would choose a destination, lodging, or transportation option that is more inclusive of all types of travelers, even if it’s more expensive, and 78% have made a travel choice based on promotions or ads they felt represented them.
This means travel brands should look for ways ensure both their offerings—and their marketing—are inclusive and welcoming to all.

These takeaways are just a sample of the insights you’ll find in the full report, based on more than 70 petabytes of Expedia Group traveler intent and demand data. To learn more, download the Q2 2022 Traveler Insights Report.
Download the Report.
About Expedia Group Media Solutions
Expedia Group Media Solutions is a global travel advertising platform that connects marketers with hundreds of millions of travelers across the Expedia Group brands. With our exclusive access to more than 70 petabytes of Expedia Group traveler search and booking data, we offer advertisers actionable insights, sophisticated targeting, and full-funnel results reporting. Our suite of solutions includes display, sponsored listings, audience extension, co-op campaigns, and custom creative campaigns – all designed to deliver on the objectives of our advertising partners and add value for travel shoppers on our branded sites globally. With a consultative approach and more than 20 years of travel and media experience, we help our advertising partners inspire, engage, and convert travelers for meaningful results. For more information, visit www.advertising.expedia.com.
© 2022 Expedia, Inc., an Expedia Group company. All rights reserved. Trademarks and logos are the property of their respective owners. CST: 2029030-50
View source
[ad_2]
Source link


